America: 2004 National Snowmaking Survey
This study, along with a similar one completed in 1999, sets a national baseline of statistically reliable information regarding the common practices and composition of snowmaking systems in America today.
by Curt Bender
Professor of
Ski Area Operations, Colorado Mountain College
Survey Statistics:
| Ski Areas Contacted- | 236 | ||
| Total Responses- | 66 | 28% | |
| Regional Breakdown- | |||
| North East | 21 of 69 | 30.4% | |
| South East | 8 of 19 | 42.1% | |
| Mid-West | 9 of 61 | 14.8% | |
| Rockies | 18 of 32 | 56.3% | |
| Intermountain | 4 of 20 | 20.0% | |
| Far West | 3 of 20 | 15.0% | |
| Pacific NW | 1 of 15 | 6.6% | |
**note: Data for the Pacific NW and Far West regions was grouped for analysis.
Average Snowmaking System in the U.S.
| 1999 | 2004 | ||||
| Terrain covered (acres/%) | 314/67.6 | 281/65.5 | |||
| Capacity (gpm) | 3,492 | 3,355 | |||
| Capacity (cu ft of air) | 18,880 | 16,248 | |||
| Avg. air/water ratio | 5.41 to 1 | 4.84 to 1 | |||
| Compressed air (diesel/electric) | 10.3/88.7 | 15/64.3 | maj in NE are diesel—make note of that | ||
| Avg. power consumed (Kw/hr) | 7,911 | 28,633 | Kill is at 20k, for 600 acres; this is nuts | ||
| Avg. operating hours, season | 841 | 1090 | |||
| Automated systems (%) | 11.5 | 12.8 | |||
| Gun type: | |||||
| Air/water | 35.2 | 43.8 | |||
| Fan | 33.7 | 34.7 | |||
| Tower | 31.1 | 29.2 | |||
| Hydrants per acre | 1.2 | 1.3 | |||
| Employees: | |||||
| Avg. # | 24 | 25 | |||
| Fulltime | 3 | 4 | |||
| fulltime seasonal | 16 | 16 | |||
| parttime seasonal | 5 | 5 | |||
| Staff turnover rate (%) | 39.6 | 25.2 | |||
| Avg. shift (hrs.) | 10.5 | 10.7 | |||
| Employees per shift | 6 | 6 | |||
| Training time, new staff (hrs.) | 22 | 29 | |||
| Classroom training (%) | NA | 15.8 | |||
| On-the-job training (%) | NA | 74.8. | |||
 According to the results of a
recent survey I conducted in December 2004 and January 2005, with support from
both NSAA and SAM, the average snowmaking system for the U.S. ski industry has
the following characteristics. Snowmaking covers 65.5 percent of a resort’s
terrain, for a total of 281.2 acres. The system has a capacity of 3,355.5
gallons per minute of water and consumes 16,248 cubic feet of air. This results
in an average air/water ratio of 4.84 to 1. (Keep in mind that this includes
systems using fan, tower and air/water guns.)
According to the results of a
recent survey I conducted in December 2004 and January 2005, with support from
both NSAA and SAM, the average snowmaking system for the U.S. ski industry has
the following characteristics. Snowmaking covers 65.5 percent of a resort’s
terrain, for a total of 281.2 acres. The system has a capacity of 3,355.5
gallons per minute of water and consumes 16,248 cubic feet of air. This results
in an average air/water ratio of 4.84 to 1. (Keep in mind that this includes
systems using fan, tower and air/water guns.)
Regarding the power source for compressed air, 15 percent was diesel, while 64.3 percent was electric. How to account for the missing 20.7 percent of compressed air source? I suspect that some fan gun air capacity was included in the responses for overall CFM, and then not accounted for here. We also asked for the average power consumed, but there was such a wide variation in the numbers that it suggests this figure was not easy to arrive at, and we have omitted it here.
The average operating hours per season is 1,089.8. These occur beginning November 13 and run through February 7, a total of 87 days, and average just over 12.5 hours per day. While total operating hours are up significantly compared to 1999, it seems most of the increase stems from higher operating hours at areas that reported in 2004-5 and not in 1999. The increase does not appear to reflect a general or steep increase in the number of operating hours overall.
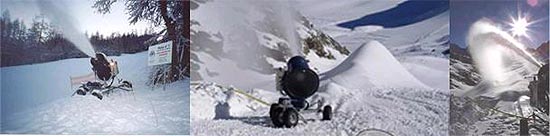
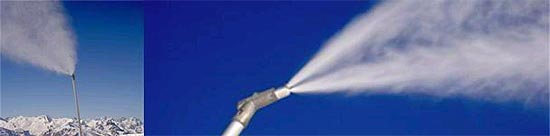
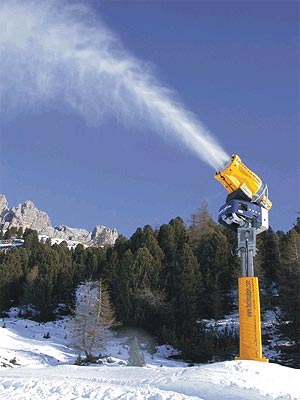
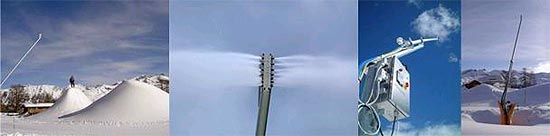
The guns used for our average snowmaking system would be split between air/water, fan, and tower guns, at 43.8 percent, 34.7 percent, and 29.2 percent respectively. The extra 7.7 percent appears to be represented by fan guns mounted on towers. We have 1.32 hydrant sets per acre of snowmaking.
Automation on the Rise
Automation of one sort or another is more widely distributed among resorts than it was in 1999. Nearly half, 48.5 percent, of the responding ski areas in 2004-5 reported the use of some automation concepts in their systems, controlling 12.8 percent of overall system capacity. In 1999, 22 percent of ski areas reported using either process control or monitoring automation systems, covering 11.5 percent of their system capacity. Monitoring alone increased from 11 percent to 25.7 percent, while process control has increased more modestly, from 11 percent to 16.6 percent. This year, 9.3 percent of hydrants are automated; in 1999, only 3.1 percent of hydrants were. I believe that in this period of limited growth in ski area revenues, the spending related to snowmaking automation has been measured, but appropriate.
Of the ski areas using “process control” automation, the average is 34.1 percent of system capacity. I perceive process control to mean a system in which the mixing of water and air are controlled via a computer. The computer is provided weather data and operational parameters from the system operator. In these systems, the computer may be used to actually start pumps and/or compressors, open/close hydrants, start and shut down guns.
Of the ski areas using computers for monitoring, the average is 9.28 percent of system capacity. Monitoring means using a computer primarily to collect data on weather, pressures, temperatures, power consumption, water and airflow, etc. This collected data then allows the snowmaking team to make decisions regarding the setup and operation of the system.
The next data group looks at the types of cooling systems being used for the air and water. Most modern systems that are built to the highest standards require some method to accurately control the delivery temperatures of both air and water to the guns. In 2004-5, 19 percent of the snowmaking systems use cooling towers to chill their water and 24 percent use pond aeration. To cool the air, 25.7 percent of systems use ambient air-cooling, 24.2 percent use water circulation cooling, and 13.6 percent use a glycol system. The survey revealed that there were no significant changes in the water or air cooling systems used today versus in 1999.
 Staffing Issues
The average snowmaking system is manned by 25 employees. Of these, 4 (16.4 percent) are full-time year round, 16 (63.2 percent) full-time seasonal, and 5 (20.4 percent) part-time seasonal, with an annual staff turnover rate of 25.2 percent. Snowmaking shifts average 10.7 hours and 6.2 snowmakers per shift. This group of data did not significantly change from 1999, with the exception of a slight migration of one full-time seasonal staff to full-time year round employment.
Most (73 percent) of the responding ski areas identified snowmobiles as their primary mid-winter transportation for snowmakers. Ten percent said they used the lifts and walking/skiing, followed by 16.4 percent “other”—which is probably split between snowcats, trucks and ATV’s. This, too, is little changed from 1999.
Training of our snowmakers took place in a classroom setting 15.8 percent of the time, with 74.8 percent of training classified as “on-the-job.” For new employees, training requires 28.7 hours. Returning employees spend an average of 11.2 hours in retraining each year. These figures represent an increase from 1999, and that’s probably a good thing. Our snowmakers are often relatively new employees who are frequently new to industrial work environments. This requires us to be vigilant in both the upfront and continued training related to safety in the workplace. As an example of their commitment to this type of vigilance, three of the respondents answered that training was constant and ongoing all season long, regardless of experience or years of service.
Thanks so much to those of you who participated in this survey. The information in this study is available to areas and others who wish to study and evaluate their own systems in comparison to those in their region as well as nationally.
Whether you took part or not, please feel free to contact me if you would like to suggest changes/additions for the next snowmaking survey follow-up. We will do it again in 2009!
| North East | South East | Mid-West | Rockies | Far West | Intermountain | National | |
| Skiable Acres | 246,0 | 125,6 | 53,2 | 1.885,0 | 1.160,3 | 1.987,0 | 821,8 |
| Snowmaking % | 90,5 | 95,0 | 83,9 | 26,1 | 20,0 | 50,0 | 65,5 |
| Snowmaking Acres | 224,0 | 119,3 | 46,8 | 382,0 | 162,0 | 1.113,0 | 281,2 |
| Ft. of Pipe | 64.635 | 133.362 | 16.922 | 44.327 | 39.297 | 55.700 | 59.125 |
| G.P.M. (water) | 4.171 | 5.531 | 2.281 | 2.079 | 2.787 | 3.450 | 3.355 |
| S.C.F.M. (air) | 20.094 | 31.858 | 2.062 | 13.658 | 12.000 | 5.000 | 16.248 |
| % air by Diesel | 23,6 | 10,0 | 7,9 | 8,3 | 27,5 | 5,0 | 15,0 |
| % air by Electric | 74,5 | 89,0 | 27,9 | 69,4 | 42,5 | 27,5 | 64,3 |
| Kilowatts/hour | 48.920 | 20.116 | 36.383 | 4.973 | 4.218 | 3.650 | 28.633 |
| Operating hours | 1.436 | 838 | 674 | 1.108 | 944 | 694 | 1.090 |
| Average Start Date | 16. Nov | 08. Dez | 18. Nov | 25. Okt | 02. Nov | 22-Oct | 13. Nov |
| Average End Date | 21. Feb | 09. Mrz | 06. Feb | 15. Jan | 23. Jan | 5-Jan | 07. Feb |
| System Automation % | 11,4 | 18,8 | 9,4 | 9,1 | 17,5 | 27,5 | 12,8 |
| % Guns A/W | 52,7 | 65,0 | 25,0 | 42,6 | 30,0 | 12,5 | 43,8 |
| % Guns Fan | 13,2 | 21,3 | 72,8 | 31,5 | 62,5 | 80,0 | 34,7 |
| % Guns Tower | 36,8 | 32,5 | 26,1 | 23,2 | 25,0 | 17,5 | 29,2 |
| Water Hydrants | 567,0 | 332,0 | 96,0 | 370,0 | 233,0 | 272,0 | 371,0 |
| Electric Hydrants | 38,0 | 41,0 | 68,2 | 42,2 | 37,5 | 140,5 | 51,4 |
| Automated Hyd. % | 5,5 | 13,6 | 5,0 | 7,9 | 17,5 | 27,5 | 9,3 |
| Crew/shift | 7,8 | 7,3 | 4,5 | 5,3 | 3,5 | 6,8 | 6,2 |
| Shift Hours | 11,2 | 11,4 | 10,2 | 10,3 | 10,5 | 9,9 | 10,7 |
| Transport Method | Snowmobile | Snowmobile | Other Methods | Snowmobile | Snowmobile | Snowmobile | Snowmobile |
| Staff Turnover % | 27,5 | 23,6 | 23,9 | 26,8 | 22,5 | 15,0 | 25,2 |
| Full Time Year Round | 4,9 | 8,3 | 4,6 | 2,0 | 1,3 | 3,0 | 4,1 |
| Full Time Seasonal | 25,1 | 7,6 | 4,4 | 16,1 | 8,0 | 17,8 | 15,8 |
| Part Time Staff | 9,5 | 3,0 | 6,2 | 2,4 | 2,5 | 0,0 | 5,1 |
| Training Hours (new emp.) | 30,9 | 26,7 | 18,7 | 30,5 | 25,8 | 40,5 | 28,7 |
| Retraining Hours | 9,7 | 10,8 | 5,7 | 18,3 | 6,3 | 14,0 | 11,2 |
Thanks for publishing permission:
Curtis W. Bender, Professor
Ski Area Operations
Colorado Mountain College
www.coloradomtn.edu/skiops
and
Ski Area Management
"This article and survey first appeard in Ski Area
Management, www.saminfo.com"